This article examines changes in the number of United Methodist churches with multiple full-time clergy between 2000 and 2019 and the changing makeup the associate staff clergy serving in these churches. The data come from those enrolled in the United Methodist pension program and are provided by through Wespath Benefits and Investments. By studying the data, we can see changing patterns in both the number of churches with multiple full-time clergy and the makeup of the full-time associate staff clergy serving within this group of churches.
Changes in Churches and Clergy
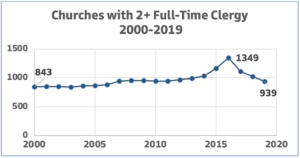
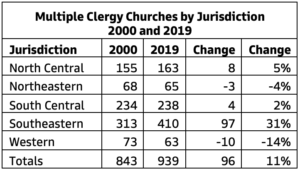
More churches have multiple full-time clergy in 2019 than in 2000. There was a net increase of 96 churches or 11 percent between 2000 and 2019 from 843 to 939 churches. The high point was 2016 with 1349 churches, with declines in the three most recent years in this study.

Almost 70 percent of these churches are in the Southeastern and South Central Jurisdictions, with significant growth in the Southeastern Jurisdiction from 313 churches in 2000 to 410 in 2019.

Despite annual fluctuation in the number of multiple clergy churches, the average number of such clergy per church remains about 2.5 with the median being 2. The number of churches with 3 or more full-time clergy also increased from 267 in 2000 to 305 in 2019, an increase of 14 percent.
Changes in Associate Staff Clergy
In looking more closely at the full-time clergy other than the lead pastors, we find an increase of 271 full-time associate staff clergy or 22 percent from 2000 to 2019. There are different categories of full-time clergy utilized by United Methodist churches: deacons, elders, associate members of the annual conference, full-time local pastors, and clergy from other denominations.
- Full-time local pastors and associate members together grew from 155 to 389, a 151 percent gain.
- Deacons increased from 143 to 327, a gain of 129 percent.
- Fewer elders serve as associate staff clergy, decreasing from 932 to 772, a decline of 17 percent.
- Clergy from other denominations, a small part of this clergy pool, increased by 13 from 15 to 28.

We have looked at the numerical changes by clergy categories engaged as full-time associate staff clergy between 2000 and 2019. These have been described in the points and table above.
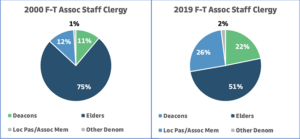
The following points and the charts below help us step back and illustrate the different picture of the composition of such staff in 2019 compared to 2000. These show us the changes in percentage for each of these categories in comparison to the total number serving as full-time associate staff clergy.
- Full-time local pastors and associate members together increased from 12 percent of associate staff clergy in 2000 to 26 percent in 2019.
- Similarly, deacons increased from 11 percent in 2000 to 22 percent in 2019.
- The proportion of elders serving as associate staff clergy decreased most of the clergy categories, from 75 percent in 2000 to 51 percent in 2019.
- Clergy from other denominations grew from 1 percent to 2 percent of the associate staff clergy pool in this period.


