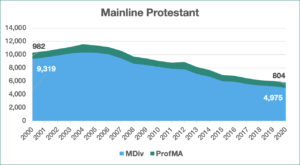
The previous two posts discussed seminary enrollment trends among students belonging to some Black Protestant and Evangelical Protestant denominations. In this post, we discuss seminary enrollment trends among students from Mainline Protestant traditions. The enrollment data come from the Association of Theological Schools (ATS) for Master of Divinity and Professional M.A. degrees from the years 2000 through 2020 for students from requested denominations enrolled in ATS-member seminaries. The student cohorts requested were Roman Catholic and selected clusters of denominations from Black Protestant, Evangelical Protestant, and Mainline Protestant denominations.
Mainline Protestant
Overall, there was a 44 percent decline in enrollment from these denominations in A.T.S. theological schools in 2020 compared to 2000. The decline in the Master of Divinity degree program (47 percent, from 9,319 in 2000 to 4,975 in 2020) was greater than the decline in the Professional M.A. (18 percent, from 982 in 2000 to 804 in 2020).
Master of Divinity. The most striking feature of these reviewed mainline Protestant denominations is the consistency of changes in M.Div. enrollment across the denominations. They all showed decreases in M.Div. enrollment numbers. While the American Baptist Churches and Presbyterian Church (U.S.A.) had the largest percentage losses in 2020 M.Div. enrollment compared to 2000 (68 percent and 58 percent respectively), all the other denominations had losses around 40 percent. The Christian Church (Disciples of Christ) had the least decline in 2020 compared with 2000 (38 percent).
Professional M.A. Three of the denominations showed more Professional M.A. enrollees in 2020 than in 2000 with the largest gains coming for the Christian Church (Disciples of Christ) with an enrollment in 2020 that was 95 percent greater than in 2000 (from 20 to 39). The Evangelical Lutheran Church in America and United Church of Christ had more modest increases of 9 percent and 6 percent respectively. Four denominations had decreases in Professional M.A. enrollment in these years. American Baptist Churches had the largest decline with 63 percent lower enrollment in 2020 than in 2000. Presbyterian Church (U.S.A.) and Episcopal enrollment declines were 40 percent and 31 percent respectively. United Methodist enrollment was virtually unchanged.
Table 1: Mainline Protestant MDiv and ProfMA ATS Enrollment, 2000-2020
| 2000 | 2020 | Change | % Change | |
| Total MDiv | 9,319 | 4,975 | -4,344 | -47% |
| Total ProfMA | 982 | 804 | -178 | -18% |
| Total Mainline Protestant | 10,301 | 5,779 | -4,522 | -44% |
Chart 1: Evangelical Protestant MDiv and ProfMA ATS Enrollment, 2000-2020

Table 2: Mainline Protestant Denominational MDiv and ProfMA ATS Enrollment, 2000-2020
| Denomination | Degree | 2000 | 2020 | Change | % Change |
| American Baptist | MDiv | 602 | 190 | -412 | -68% |
| American Baptist | ProfMA | 133 | 49 | -84 | -63% |
| Christian (Disciples of Christ) | MDiv | 426 | 265 | -161 | -38% |
| Christian (Disciples of Christ) | ProfMA | 20 | 39 | 19 | 95% |
| Evangelical Lutheran Church in America | MDiv | 1,391 | 852 | -539 | -39% |
| Evangelical Lutheran Church in America | ProfMA | 110 | 120 | 10 | 9% |
| Episcopal | MDiv | 1,055 | 604 | -451 | -43% |
| Episcopal | ProfMA | 123 | 85 | -38 | -31% |
| Presbyterian Church (U.S.A.) | MDiv | 1,712 | 724 | -988 | -58% |
| Presbyterian Church (U.S.A.) | ProfMA | 213 | 127 | -86 | -40% |
| United Church of Christ | MDiv | 606 | 339 | -267 | -44% |
| United Church of Christ | ProfMA | 31 | 33 | 2 | 6% |
| United Methodist | MDiv | 3,527 | 2,001 | -1,526 | -43% |
| United Methodist | ProfMA | 352 | 351 | -1 | 0% |


